import pandas as pd
import numpy as np
import matplotlib.pyplot as plt
from datetime import time, timedelta
import pytz
import math
# ==========================================
# 1. CONFIGURATION
# ==========================================
CSV_PATH = 'NQ_1m.csv'
# --- DATA SETTINGS ---
DATA_SOURCE_TYPE = 'FIXED_EST'
# Void dates (Degraded data)
VOID_DATES_STR = {
'2017-11-13', '2018-10-21', '2019-01-15', '2019-02-22',
'2019-03-13', '2019-03-26', '2020-02-27', '2020-02-28',
'2020-06-30', '2020-07-01', '2021-12-05', '2022-01-02',
'2025-09-17', '2025-09-24', '2025-11-28'
}
VOID_DATES = {pd.to_datetime(d).date() for d in VOID_DATES_STR}
START_DATE = '2022-06-01'
END_DATE = '2025-11-01'
# --- ACCOUNT SETTINGS ---
INITIAL_CAPITAL = 200_000
COMMISSION_PER_CONTRACT = 2.74
POINT_VALUE = 20.0
RISK_FREE_RATE = 0.04
# --- SIZING SETTINGS ---
# If True, size scales with equity (200k = 1.0, 220k = 1.1, etc.)
# increments of 0.1 (approx 1 micro per 20k equity variance)
ENABLE_DYNAMIC_SIZING = True
# If Dynamic is False, this static scale is used
BASELINE_SCALE_FACTOR = 2
# --- STRATEGY PARAMS ---
VOL_MULT_LONG = 0
VOL_MULT_SHORT = 0
VWAP_REG_LEN = 1
MAX_TRADES_PER_DAY = 1
MAX_VWAP_DEV = 1
ENABLE_5M_EXIT = True
ENABLE_NY_VWAP_EXIT = True
# --- TIME SETTINGS ---
TIME_ORB_START = time(9, 30)
TIME_ORB_END = time(9, 45)
TIME_TRADE_START = time(9, 45)
TIME_TRADE_END = time(14, 0)
TIME_EOD_EXIT = time(14, 59)
ANCHOR_SESSION = time(18, 0)
ANCHOR_NY = time(9, 30)
# ==========================================
# 2. HELPER FUNCTIONS
# ==========================================
def load_and_prep_data(path, date_col='datetime', tz_type='WALL_TIME'):
print(f"Loading {path}...")
try:
df = pd.read_csv(path)
df.columns = df.columns.str.lower().str.strip()
df[date_col] = pd.to_datetime(df[date_col])
df.set_index(date_col, inplace=True)
df.sort_index(inplace=True)
target_tz = pytz.timezone('America/New_York')
if tz_type == 'FIXED_EST':
df.index = df.index.tz_localize('Etc/GMT+5')
df.index = df.index.tz_convert(target_tz)
elif tz_type == 'UTC':
df.index = df.index.tz_localize('UTC')
df.index = df.index.tz_convert(target_tz)
elif tz_type == 'WALL_TIME':
df.index = df.index.tz_localize(target_tz, ambiguous='infer')
return df.dropna()
except Exception as e:
print(f"Error loading data: {e}")
return pd.DataFrame()
def calculate_vwap_robust(df, anchor_time):
df = df.copy()
minutes = df.index.hour * 60 + df.index.minute
anchor_min = anchor_time.hour * 60 + anchor_time.minute
day_change = pd.Series(df.index.date).diff().values != pd.Timedelta(0)
day_change[0] = True
is_after_anchor = minutes >= anchor_min
is_after_anchor_prev = np.roll(is_after_anchor, 1)
is_after_anchor_prev[0] = False
time_cross = (is_after_anchor & ~is_after_anchor_prev)
if anchor_time.hour == 9:
reset_mask = day_change | time_cross
else:
reset_mask = time_cross
reset_mask[0] = True
group_id = reset_mask.cumsum()
df['hlc3'] = (df['high'] + df['low'] + df['close']) / 3
df['pv'] = df['hlc3'] * df['volume']
grouper = df.groupby(group_id)
cum_vol = grouper['volume'].cumsum()
cum_pv = grouper['pv'].cumsum()
vwap = cum_pv / cum_vol
df['p2v'] = (df['hlc3'] ** 2) * df['volume']
cum_p2v = grouper['p2v'].cumsum()
variance = (cum_p2v / cum_vol) - (vwap ** 2)
stdev = np.sqrt(variance.clip(lower=0))
return vwap, stdev
def calculate_slope(series, window=100):
y = series.values
x = np.arange(window)
sum_x = x.sum()
sum_x2 = (x**2).sum()
divisor = window * sum_x2 - sum_x**2
slopes = np.full(len(y), np.nan)
if len(y) > window:
strides = (y.strides[0], y.strides[0])
shape = (len(y) - window + 1, window)
y_strided = np.lib.stride_tricks.as_strided(y, shape=shape, strides=strides)
sum_y = y_strided.sum(axis=1)
sum_xy = (y_strided * x).sum(axis=1)
slopes[window-1:] = (window * sum_xy - sum_x * sum_y) / divisor
return pd.Series(slopes, index=series.index)
def get_base_qty(t):
return 1
def analyze_performance(trades_df, price_df):
if trades_df.empty: return
min_date = trades_df['exit_ts'].min()
max_date = trades_df['exit_ts'].max()
price_df_filtered = price_df[(price_df.index >= min_date) & (price_df.index <= max_date)]
daily_pnl = trades_df.groupby(trades_df['exit_ts'].dt.date)['pnl'].sum()
daily_pnl.index = pd.to_datetime(daily_pnl.index)
# Strip timezone for alignment
price_df_daily = price_df_filtered['close'].resample('B').last()
price_df_daily.index = price_df_daily.index.tz_localize(None).normalize()
all_dates = pd.date_range(daily_pnl.index.min(), daily_pnl.index.max(), freq='B')
daily_pnl = daily_pnl.reindex(all_dates).fillna(0)
price_df_daily = price_df_daily.reindex(all_dates).ffill()
benchmark_rets = price_df_daily.pct_change().fillna(0)
strat_rets = daily_pnl / INITIAL_CAPITAL
aligned_df = pd.DataFrame({'strat': strat_rets, 'bench': benchmark_rets}).dropna()
total_trades = len(trades_df)
gross_win = trades_df[trades_df['pnl'] > 0]['pnl'].sum()
gross_loss = trades_df[trades_df['pnl'] <= 0]['pnl'].sum()
profit_factor = abs(gross_win / gross_loss) if gross_loss != 0 else np.inf
win_rate = (trades_df['pnl'] > 0).mean()
ANN_FACTOR = 252
avg_daily_ret = strat_rets.mean()
std_daily_ret = strat_rets.std()
annualized_ret = avg_daily_ret * ANN_FACTOR
sharpe = (avg_daily_ret / std_daily_ret) * np.sqrt(ANN_FACTOR) if std_daily_ret != 0 else 0
downside_rets = strat_rets[strat_rets < 0]
downside_std = downside_rets.std()
sortino = (avg_daily_ret / downside_std) * np.sqrt(ANN_FACTOR) if downside_std != 0 else 0
full_equity = daily_pnl.cumsum() + INITIAL_CAPITAL
running_max = full_equity.cummax()
drawdown_pct = (full_equity - running_max) / running_max
max_dd_pct = drawdown_pct.min()
max_dd_amt = (full_equity - running_max).min()
calmar = annualized_ret / abs(max_dd_pct) if max_dd_pct != 0 else 0
if not aligned_df.empty:
covariance = aligned_df.cov().iloc[0, 1]
bench_var = aligned_df['bench'].var()
beta = covariance / bench_var if bench_var != 0 else 0
treynor = (annualized_ret - RISK_FREE_RATE) / beta if abs(beta) > 0.0001 else 0
else:
beta = 0; treynor = 0
print("\n" + "="*45)
print(f" KINTOUN PERFORMANCE ({START_DATE} to {END_DATE})")
print(f" Dynamic Sizing: {ENABLE_DYNAMIC_SIZING}")
print("="*45)
print(f"Total Trades: {total_trades}")
print(f"Win Rate: {win_rate:.2%}")
print(f"Profit Factor: {profit_factor:.2f}")
print("-" * 45)
print(f"Total PnL: ${trades_df['pnl'].sum():,.2f}")
print(f"Final Equity: ${trades_df['equity'].iloc[-1]:,.2f}")
print(f"Annualized Ret: {annualized_ret:.2%}")
print("-" * 45)
print(f"Max Drawdown: {max_dd_pct:.2%} (${max_dd_amt:,.2f})")
print(f"Sharpe Ratio: {sharpe:.2f}")
print(f"Sortino Ratio: {sortino:.2f}")
print(f"Calmar Ratio: {calmar:.2f}")
print(f"Treynor Ratio: {treynor:.2f} (Beta: {beta:.2f})")
print("="*45)
print("\n[EXIT REASON DISTRIBUTION]")
print(trades_df['reason'].value_counts())
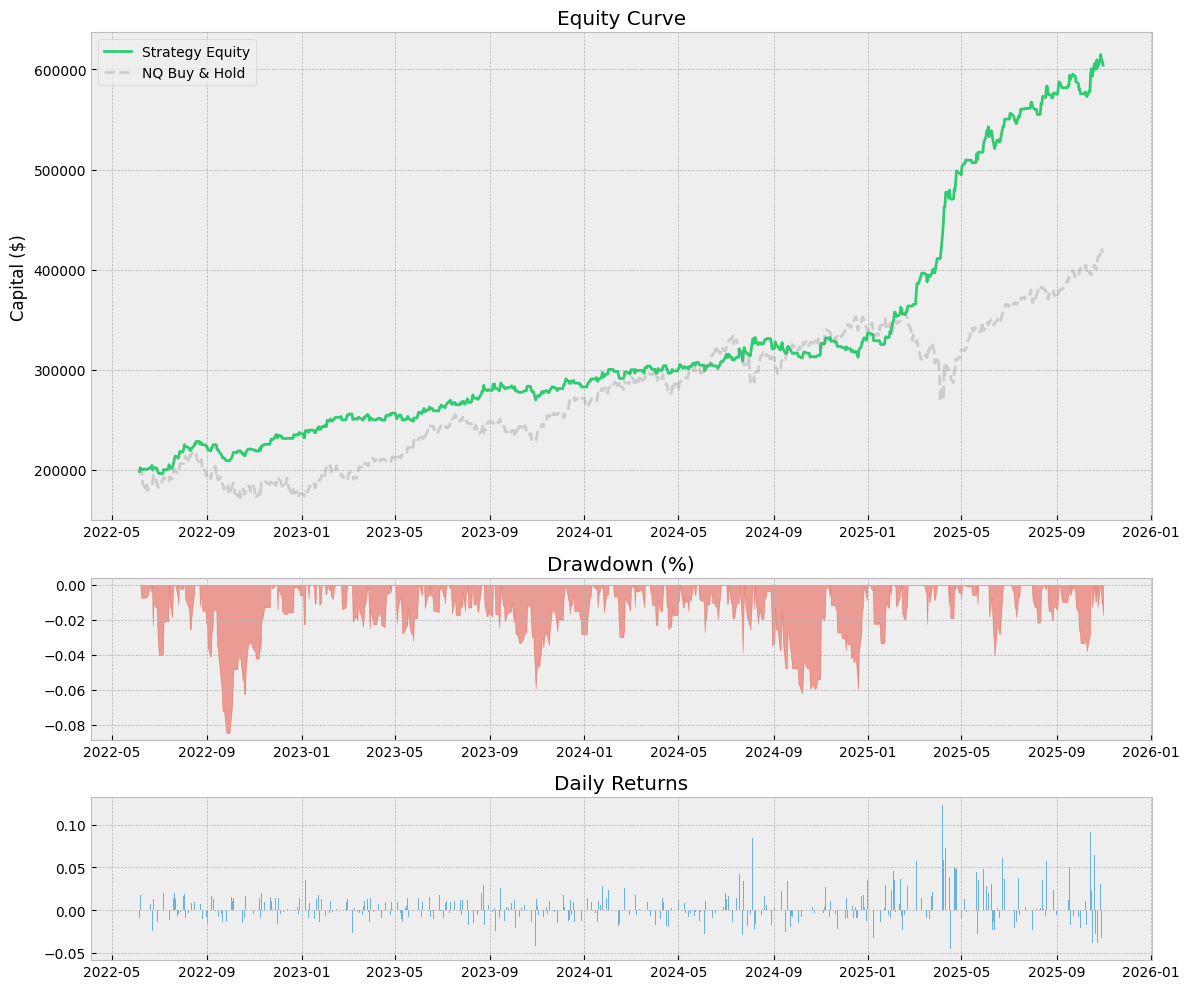
plt.style.use('bmh')
fig = plt.figure(figsize=(12, 10))
gs = fig.add_gridspec(3, 1, height_ratios=[3, 1, 1])
ax1 = fig.add_subplot(gs[0])
ax1.plot(full_equity.index, full_equity, label='Strategy Equity', color='#2ecc71')
if not aligned_df.empty:
bench_equity = (1 + aligned_df['bench']).cumprod() * INITIAL_CAPITAL
ax1.plot(bench_equity.index, bench_equity, label='NQ Buy & Hold', color='gray', alpha=0.3, linestyle='--')
ax1.set_title(f'Equity Curve')
ax1.legend()
ax1.set_ylabel('Capital ($)')
ax2 = fig.add_subplot(gs[1], sharex=ax1)
ax2.fill_between(drawdown_pct.index, drawdown_pct, 0, color='#e74c3c', alpha=0.5)
ax2.set_title('Drawdown (%)')
ax3 = fig.add_subplot(gs[2], sharex=ax1)
ax3.bar(strat_rets.index, strat_rets, color='#3498db', alpha=0.7)
ax3.set_title('Daily Returns')
plt.tight_layout()
plt.show()
# ==========================================
# 4. MAIN EXECUTION
# ==========================================
def run_strategy():
df = load_and_prep_data(CSV_PATH, tz_type=DATA_SOURCE_TYPE)
if df.empty: return
print("Calculating Indicators...")
df['session_vwap'], _ = calculate_vwap_robust(df, ANCHOR_SESSION)
df['ny_vwap'], df['ny_std'] = calculate_vwap_robust(df, ANCHOR_NY)
df[['session_vwap','ny_vwap','ny_std']] = df[['session_vwap','ny_vwap','ny_std']].ffill()
df['upper'] = df['ny_vwap'] + (MAX_VWAP_DEV * df['ny_std'])
df['lower'] = df['ny_vwap'] - (MAX_VWAP_DEV * df['ny_std'])
df['slope'] = calculate_slope(df['session_vwap'], window=VWAP_REG_LEN)
df['vol_sma'] = df['volume'].rolling(20).mean()
print(f"Filtering data from {START_DATE} to {END_DATE}...")
if START_DATE:
df = df[df.index >= pd.to_datetime(START_DATE).tz_localize('America/New_York')]
if END_DATE:
df = df[df.index < pd.to_datetime(END_DATE).tz_localize('America/New_York') + timedelta(days=1)]
if df.empty:
print("Error: No data in date range.")
return
print(f"Simulation Range: {df.index[0]} to {df.index[-1]}")
trades = []
active = None
# Track Equity State
current_equity = INITIAL_CAPITAL
curr_date = None
orb_h, orb_l = np.nan, np.nan
broke_up, broke_dn = False, False
retest_ok = False
break_idx = 0
day_trades = 0
# Pre-fetch numpy arrays
idx_arr = df.index
open_arr = df['open'].values
high_arr = df['high'].values
low_arr = df['low'].values
close_arr = df['close'].values
vol_arr = df['volume'].values
ny_vwap_arr = df['ny_vwap'].values
slope_arr = df['slope'].values
vol_sma_arr = df['vol_sma'].values
upper_arr = df['upper'].values
lower_arr = df['lower'].values
for i in range(len(df)):
ts = idx_arr[i]
t = ts.time()
d = ts.date()
# --- NEW DAY LOGIC ---
if curr_date != d:
curr_date = d
orb_h, orb_l = np.nan, np.nan
broke_up, broke_dn = False, False
retest_ok = False
break_idx = 0
day_trades = 0
# Force EOD VOID
if active:
active = None
# --- VOID DATE CHECK ---
if d in VOID_DATES:
continue
# ORB
if TIME_ORB_START <= t < TIME_ORB_END:
orb_h = high_arr[i] if np.isnan(orb_h) else max(orb_h, high_arr[i])
orb_l = low_arr[i] if np.isnan(orb_l) else min(orb_l, low_arr[i])
continue
if np.isnan(orb_h): continue
orb_rng = orb_h - orb_l
# Break/Retest
if high_arr[i] > orb_h and not broke_up:
broke_up = True; break_idx = i; retest_ok = False
if low_arr[i] < orb_l and not broke_dn:
broke_dn = True; break_idx = i; retest_ok = False
if broke_up and low_arr[i] <= orb_h: retest_ok = True
if broke_dn and high_arr[i] >= orb_l: retest_ok = True
# Exits
if active:
exit_px = None; reason = ""
if t >= TIME_EOD_EXIT:
exit_px = close_arr[i]; reason = "EOD"
elif active['type'] == 'long':
if low_arr[i] <= active['sl']: exit_px = active['sl']; reason = "SL"
elif high_arr[i] >= active['tp']: exit_px = active['tp']; reason = "TP"
elif ENABLE_NY_VWAP_EXIT and close_arr[i] < ny_vwap_arr[i]: exit_px = close_arr[i]; reason = "VWAP"
else:
if high_arr[i] >= active['sl']: exit_px = active['sl']; reason = "SL"
elif low_arr[i] <= active['tp']: exit_px = active['tp']; reason = "TP"
elif ENABLE_NY_VWAP_EXIT and close_arr[i] > ny_vwap_arr[i]: exit_px = close_arr[i]; reason = "VWAP"
if not exit_px and ENABLE_5M_EXIT:
if 0 < (i - active['ent_idx']) <= 5 and t.minute % 5 == 4:
if i >= 4:
op_5m = open_arr[i-4]
if active['type'] == 'long' and close_arr[i] < op_5m: exit_px = close_arr[i]; reason = "5m"
elif active['type'] == 'short' and close_arr[i] > op_5m: exit_px = close_arr[i]; reason = "5m"
if exit_px:
diff = (exit_px - active['ent_px']) if active['type'] == 'long' else (active['ent_px'] - exit_px)
pnl = (diff * active['qty'] * POINT_VALUE) - (COMMISSION_PER_CONTRACT * active['qty'])
# UPDATE RUNNING EQUITY
current_equity += pnl
trades.append({**active, 'exit_px': exit_px, 'exit_ts': ts, 'reason': reason, 'pnl': pnl})
active = None
continue
# Entries
if not (TIME_TRADE_START <= t < TIME_TRADE_END): continue
if day_trades >= MAX_TRADES_PER_DAY: continue
c_long = (broke_up and retest_ok and i > break_idx and close_arr[i] > orb_h and low_arr[i] <= orb_h)
c_short = (broke_dn and retest_ok and i > break_idx and close_arr[i] < orb_l and high_arr[i] >= orb_l)
if not c_long and not c_short: continue
if not (lower_arr[i] < close_arr[i] < upper_arr[i]): continue
slp = slope_arr[i]
if np.isnan(slp): continue
vol_chk = vol_arr[i] > (vol_sma_arr[i] * (VOL_MULT_LONG if c_long else VOL_MULT_SHORT))
if not vol_chk: continue
if c_long and slp > 0 and close_arr[i] > ny_vwap_arr[i] and close_arr[i] < orb_h + orb_rng:
base_q = get_base_qty(t)
# --- SCALING LOGIC ---
scale = BASELINE_SCALE_FACTOR
if ENABLE_DYNAMIC_SIZING:
# Ratio: Current / Initial
ratio = BASELINE_SCALE_FACTOR * current_equity / INITIAL_CAPITAL
# Floor to nearest 0.1 increment
scale = math.floor(ratio * 10) / 10.0
# Sanity check: Don't go below 0.1 scale
scale = max(0.1, scale)
q = base_q * scale
if q > 0:
active = {'type':'long', 'ent_ts':ts, 'ent_px':close_arr[i], 'qty':q,
'sl':orb_l, 'tp':orb_h+orb_rng, 'ent_idx':i, 'scale':scale}
day_trades += 1; broke_up = False; retest_ok = False
elif c_short and slp < 0 and close_arr[i] < ny_vwap_arr[i] and close_arr[i] > orb_l - orb_rng:
base_q = get_base_qty(t)
scale = BASELINE_SCALE_FACTOR
if ENABLE_DYNAMIC_SIZING:
ratio = BASELINE_SCALE_FACTOR * current_equity / INITIAL_CAPITAL
scale = math.floor(ratio * 10) / 10.0
scale = max(0.1, scale)
q = base_q * scale
if q > 0:
active = {'type':'short', 'ent_ts':ts, 'ent_px':close_arr[i], 'qty':q,
'sl':orb_h, 'tp':orb_l-orb_rng, 'ent_idx':i, 'scale':scale}
day_trades += 1; broke_dn = False; retest_ok = False
if len(trades) > 0:
res = pd.DataFrame(trades)
# Recalculate full equity curve from PnL for analysis consistency
res['equity'] = res['pnl'].cumsum() + INITIAL_CAPITAL
print("\nExporting trades to 'kintoun_trade_log.csv'...")
res.to_csv("kintoun_trade_log.csv", index=False)
analyze_performance(res, df)
else:
print("No trades generated.")